EUR/CAD chart patterns demonstrate a particularly discouraging streak of losses in my trading record: from last year’s descending triangle, to H4 descending channel of September 2012, to a daily bullish flag
last month. The most recent development in this currency pair’s price
curve, like 8 months ago, is also a descending channel, although this
one is more easily plotted on D1 rather than H4.
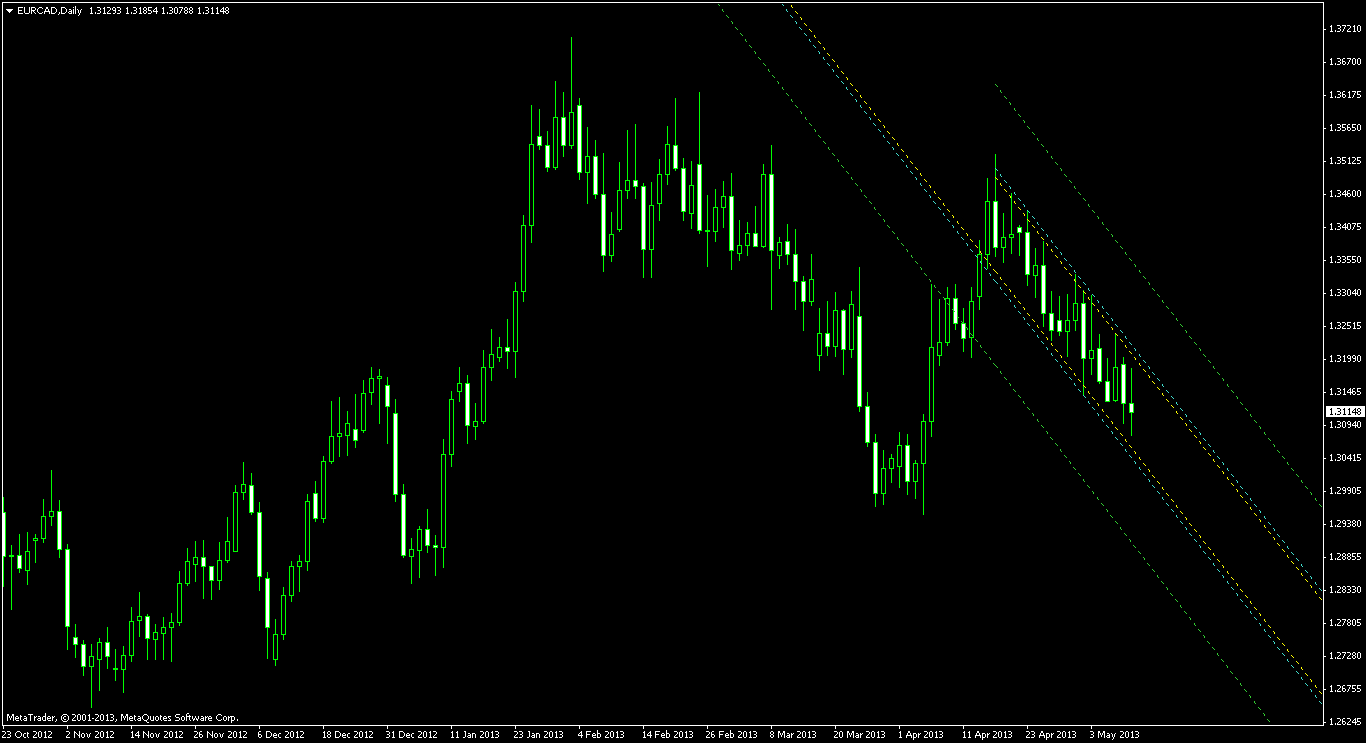
The chart below shows the channel outlined with yellow border lines. The cyan lines close to the channel lines are the entry levels for breakout trading. The green lines away from the channel are my potential profit targets. They were added using my free ChannelPattern script. I will consider only bullish breakout signal from this formation as the descending channel is considered to be a continuation Forex pattern for an ascending price wave.

You can download my MetaTrader 4 chart template for this EUR/CAD pattern. You may also use my free Chart Pattern Helper EA to trade this pattern.
If you have any questions or comments regarding this descending channel on EUR/CAD chart, please feel free to submit them via the form below.
The chart below shows the channel outlined with yellow border lines. The cyan lines close to the channel lines are the entry levels for breakout trading. The green lines away from the channel are my potential profit targets. They were added using my free ChannelPattern script. I will consider only bullish breakout signal from this formation as the descending channel is considered to be a continuation Forex pattern for an ascending price wave.
You can download my MetaTrader 4 chart template for this EUR/CAD pattern. You may also use my free Chart Pattern Helper EA to trade this pattern.
If you have any questions or comments regarding this descending channel on EUR/CAD chart, please feel free to submit them via the form below.


0 comments:
Post a Comment